
Share
By Jim Stanford
Fiscal conservatives always claim that the necessity of balancing the government’s budget is a matter of ‘hard mathematics’. A government only takes in so much revenue. Basic arithmetic implies that’s all it can spend – at least in the long run. Cue the requisite analogy to household finances, and the image of prudent pilgrims sitting at their kitchen tables, trying to balance their own budgets. “Ma and Pa know they can only spend as much as they take in; it’s time governments learned the same thing.”
This old parable is wrong on every count. First of all, it is not a remotely accurate description of how household finances actually work in the real world. Households regularly and consistently take on large amounts of debt – and, within limit, it’s a good thing they do. That’s how households pay for essential purchases, that leave them (and society) better off: like buying a home, buying a car, sending a child to university, and other long-lived, productive investments.
And while the debts of individual families tend to rise and fall over time, the debt burden of the entire household sector has been heading only in one direction: up. Households in aggregate have been “living beyond their means” for decades. As of end-2020, collective household debt in Canada reached 112% of GDP (and over 200% of household disposable income), the highest in history. In fact, households carry far more debt than Canadian governments. So that old kitchen table parable favoured by budget-cutting politicians is just a historical fiction.
But the patronizing claim of fiscal conservatives that those who resist balancing the budget just don’t understand math, is also wrong. They point out the obvious truth that an ongoing deficit adds to the accumulated stockpile of debt – and that that stockpile can easily be described with scary big numbers. “Over a trillion dollars” is the frightening claim made about federal debt. Never mind that the Canadian economy generates $2.3 trillion worth of value-added (and much more in total revenues) every year.
The same temptation to use “scary numbers” to prepare the public for austerity is visible in Newfoundland and Labrador too. The projected provincial deficit is almost a billion dollars, the alarmists cry. That adds up. That’s just not sustainable. DO THE MATH!
OK, let’s do some math. First of all, it’s obviously not the number of dollars that matters for any macroeconomic or fiscal variable. It’s their relative importance, in the context of overall economic activity. Newfoundland and Labrador’s provincial GDP will exceed $36 billion this year. That’s an even bigger number. Relative to the size of the provincial economy, a $1 billion deficit is not much at all (under 3%).
Yes, each year’s deficit is added to the previous accumulated debt. After this year, that debt will equal about $17 billion – reflecting all the previous provincial deficits, going all the way back to 1949. As with deficits, the appropriate way to measure the debt is not in dollars, but relative to the size of the economy that supports that debt: in other words, as a share of GDP. By the end of this year the debt will be 47% of projected GDP. That’s higher than 10 years ago (when the provincial budget was flush with oil revenues), but far less than 20 years ago – after the fisheries collapse and other crises both caused and necessitated large provincial deficits for many years.
Now here’s where the math really comes into play. It isn’t even the debt (relative to GDP) that is the ultimate constraint on provincial government finances. It’s the cost of servicing that debt that really matters. That represents the flow of current dollars diverted to pay interest on the cumulative total of past debts. If the rate of interest paid on debt is low, the cost of servicing debt is low. If the rate of interest is zero, then the debt is ‘free’.
This chart illustrates the trend in provincial debt service charges relative to GDP. This year it will be less than 3% of NL GDP. That’s about one-third of the debt service costs incurred by the provincial government in the 1990s. Most important, the debt service ratio has not significantly increased, even with the big deficits incurred recently as a result of the COVID-19 pandemic and resulting chaos (including last year’s meltdown in oil prices).
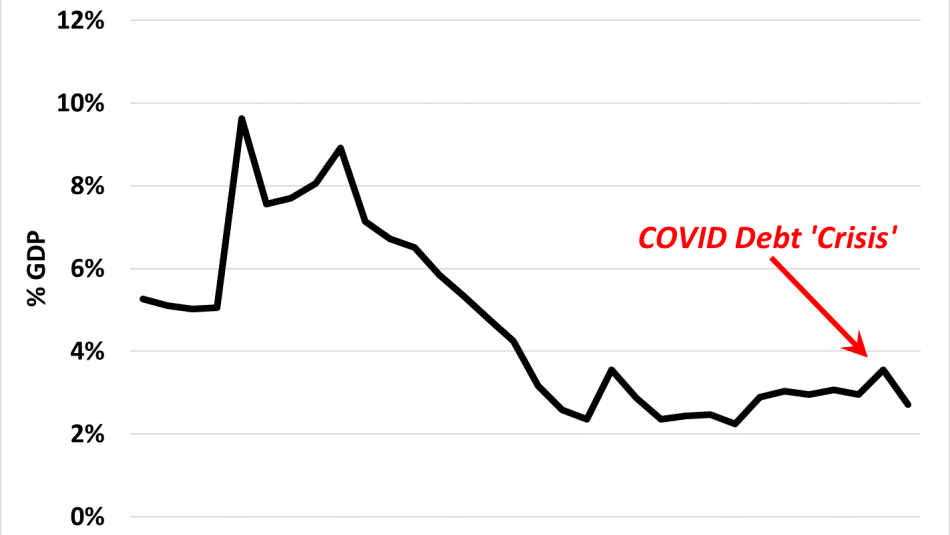
Why haven’t interest costs exploded, given seemingly large and scary provincial deficits? First, provincial GDP has grown (including a strong rebound from last year’s COVID contraction), and that offsets some of the impact of a larger accumulated debt. Second, interest rates have declined dramatically. That in turn drives two related benefits for debt servicing. Number one: interest on current and future deficits is reduced, given that interest rates fell dramatically after the pandemic. New provincial bonds are being issued (some for up to 30 years into the future) at interest rates between 1% and 3%. Number two: even previous provincial bonds that come due are also being refinanced at much lower interest rates (just as homeowners can refinance their mortgages at current low rates).
The combined effect is a big decline in the weighted average interest rate paid on provincial debt. For the current fiscal year, it will be about 3.7%. In future years it will be lower, even if current interest rates rise somewhat (as some, but not all, forecasters think might happen). That’s because the savings to Newfoundland and Labrador of refinancing old debt at lower rates will outweigh any incremental costs from modest increases in those current low rates.
The math gets even more interesting. The future evolution of the debt ratio (as a share of GDP) depends arithmetically on two critical variables: the nominal rate of interest, and the rate of growth of nominal GDP. The algebra is a bit complicated (I summarize it in the appendix for anyone who wants to check), but the conclusion is undeniable and profound: if the nominal interest rate is less than the growth rate of nominal GDP, the debt ratio will automatically tend to decline over time. That’s because the impact of interest payments on the deficit (and hence the debt) is outweighed by the expansion of the denominator of the debt ratio (that is, the size of the provincial economy). In fact, if the interest rate is significantly lower than the growth rate (remember, on this issue it is nominal growth, including inflation, that matters, not the more commonly reported real growth rate), then the government can run a deficit every year and still see the debt ratio shrink. And if average interest rates are falling at the same time (as will occur over the coming years for Newfoundland and Labrador), then those deficits can be even bigger. One final mathematical sweetener: strong growth (that is, a higher g) also tends to reduce the operating deficit, by increasing tax revenues.
It seems counter-intuitive that a government can run ongoing deficits, while simultaneously reducing its debt. But it’s not magic. It’s math. And it completely refutes the conventional argument that NL residents (or other Canadians) must focus on reducing deficits as the top priority, even if that means panful cuts in health care, education, and other essential public services.
The key things to focus on, as illuminated by this hard math, are getting the rate of (nominal) economic growth up, and keeping the rate of interest down. Would slashing public programs in a misguided effort to reduce the deficit help either of those? Not likely. The negative impacts of spending cutbacks on employment and growth are predictable and well-known. Economists are now near-unanimous, for example, that the deep cuts imposed in Europe in the 2010s (especially in hard-hit countries like Greece, Spain, and Italy) were entirely counter-productive: they ushered in a decade of stagnation, and actually made the problem worse, not better.
And by slashing investments in human and social capacities (by reducing access to university education, for example, or eliminating health care services), we reduce Newfoundland and Labrador’s potential to grow in the future. That’s especially dangerous as the global economy continues to focus more on innovation, human capital, and infrastructure, rather than resource extraction, as the central drivers of growth. We need healthier, more educated, more capable people in the labour force. And we need to attract more people (both immigrants to Canada, and returning interprovincial migrants) to grow the province’s population and economy. Turning the province into a wasteland of austerity rather than an island of opportunity will drive those people away – inevitably followed by still more of the province’s youth.
Newfoundland and Labrador faces serious fiscal issues because of the COVID recession and other challenges (like the global transition away from fossil fuels). But it is does not remotely face a debt crisis. As measured by debt service charges relative to GDP, the province’s finances are in much better state than in the not-so-distant past. There is no need to sacrifice future human and community wellbeing to a misplaced and superstitious obsession with balancing the books. Newfoundland and Labrador should focus on what is far more important to long-run fiscal stability: putting its people to work in decent jobs, producing real goods and services (including public services), and making the province an even more attractive, livable place. Austerity will have the opposite effect.
That’s not just my opinion. That’s the hard math of it.
Jim Stanford is Economist and Director of the Centre for Future Work. This commentary is based on his presentation to the recent CARE Conference on Newfoundland and Labrador’s Economic and Fiscal Trajectory at Memorial University.
Appendix: Understanding Movement in the Debt/GDP Ratio
The rate of change in the ratio of public debt (D) to GDP, measured in proportional terms, equals the rate of growth of debt less the rate of growth of GDP (which we call g below).
The proportional growth in debt equals the current deficit (Def) relative to the previous stock of debt (Dt-1).
The current year’s deficit equals the sum of debt service charges (equal to the interest rate i times the previous debt) plus the operating deficit (OD), representing the cost of all current programs less incoming revenues.
By simplifying the equation, we isolate the interest rate and the nominal GDP growth rate.
The change in the debt ratio (as a share of GDP) thus equals the difference between the interest rate and the growth rate, plus the proportionate operating deficit (measured as a proportion of the previous accumulated debt).
The implications of this formula are as follows. If the operating budget (excluding debt charges) is balanced, the debt ratio will decline if nominal GDP growth exceeds the nominal interest rate. Alternatively, the debt ratio can be maintained at a stable level, if the operating deficit (as a proportion of the previous accumulated debt) is no larger (in absolute terms) than the difference between the interest and growth rates. In other words, if the interest rate is 2 percentage points lower than the GDP growth rate, then the government can run an operating deficit equal to 2% of the previous year’s accumulated debt. The total deficit consistent with a stable debt ratio is even larger, since it includes the debt service charges.
Newfoundland and Labrador’s accumulated debt at the end of 2020 was around $16 billion (about 50% of GDP that year – keeping in mind that nominal GDP was depressed in 2020 by the COVID recession and the resulting collapse of oil prices). The nominal average effective interest rate is currently about 3.7%. If nominal GDP grows at, say, 5%, that means the province could run an operating deficit equal to 1.3% of $16 billion, or about $200 million, plus the interest charges on the debt, without increasing the debt ratio. In reality, Newfoundland and Labrador plans to run an operating surplus this year (that is, incoming revenues are more than enough to pay for all current programs), and hence the debt ratio will fall. Over the past 30 years, Newfoundland and Labrador has run an operating deficit only 4 times: from 2014-15 through 2016-17 (due to the fall in oil prices) and then again in 2020-21 (due to COVID-19). So on an ongoing basis, Newfoundland and Labrador clearly collects enough revenue to pay for current services. It is only trends in interest rates and nominal GDP growth that open the possibility for larger deficits and a rising debt ratio.