

Share
On paper it looks like Canada’s real hourly wage flat lined between September 2019 and September 2022 with a paltry increase of just 13 cents. But without changes in the composition of the labour market the average hourly wage would have been even worse.
The chart below shows the change in the real average hourly wage nationally and provincially. The measure denoted in blue shows the real average hourly wage without adjusting for industry changes in employment. The measure denoted in green shows the change in the real average wage if the labour market composition was the same today as it was in September 2019.
Overall, changes in the composition of the labour market are pushing the real wage higher than it would have otherwise been in every province if workers hadn’t migrated to different industries (or in the case of high paid people who work from home, migrated to different parts of the country).
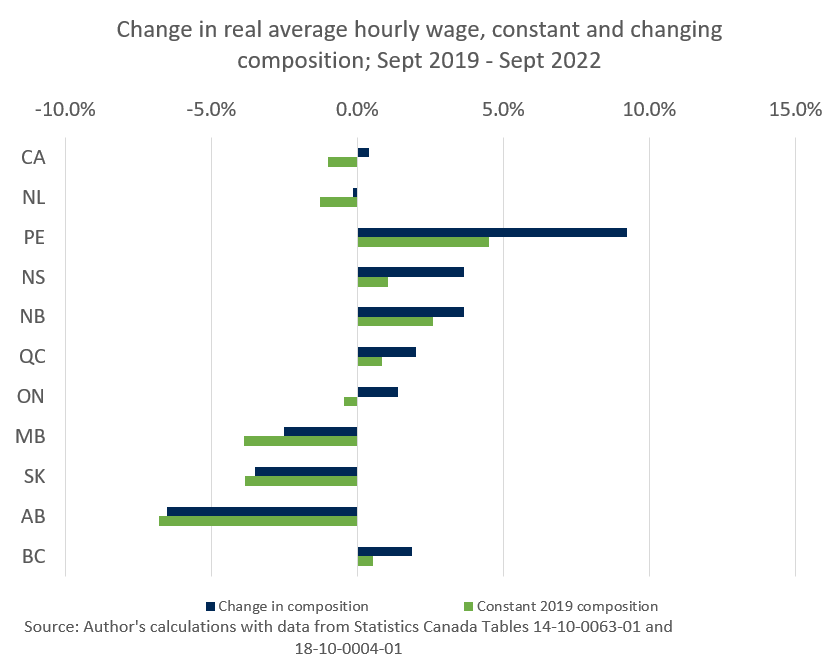
For example, holding the labour market composition constant to September 2019 reduces the real average hourly wage by $1.20 in Prince Edward Island – showing that the composition effect is responsible for 50% of the increase in the real average hourly wage.
The effect is responsible for closer to 70% of the change in the wage in Nova Scotia and British Columbia, 60% in Quebec and 30% in New Brunswick.
Holding the composition of the labour market constant flips the change in the real average hourly wage from positive to negative in Ontario. Without some workers moving to higher wage industries in the province, the real average hourly wage would have actually declined.
The oil producing provinces can be split into two groups. In Manitoba and Newfoundland and Labrador the decline in the real average hourly wage would be much higher if there was no change in the composition of the labour market.
In Alberta and Saskatchewan however, the difference is just 10 and 11 cents. This suggests that the decline in the real average hourly wage is the result of a decline in the average wage within industries instead of workers moving between them.
Indeed, Alberta saw the largest or second largest decline in the real average hourly wage in 10 out of 16 industries including mining, oil and gas, construction, transportation and warehousing, education and health care and social assistance.
This finding underscores the fact that wages within industries are not growing as fast as they could be to address labour shortage issues.
In fact, simply looking at the average high level number masks the fact that workers are adjusting to low pay and frustrating working conditions with their feet by moving to industries with higher quality work.